
Part 2 of our 2026 State of Working Ohio report.
< Part 1: Minimum Wage || Part 3: Unemployment Compensation >
The median wage is in the exact middle of the pay scale: Half of all workers are paid more, and half are paid less. It’s commonly considered the wage of a “typical” worker. A drop in the median wage is evidence that a broad range of workers are facing economic losses.
The median wage in Ohio decreased between 2024 and 2025, falling from an inflation-adjusted $25.44 to $24.90.[53] This was against the trend of the state and nation, which have seen steady increases since pandemic recovery in 2022. (Steady wage gains indicate economic growth is reaching workers across the wage spectrum.) In 2024, the national median wage led Ohio’s by just 3 cents; in 2025 that difference increased to 77 cents.
Figure 2.1 shows how Ohio’s median hourly wage has been lagging the nation’s side 2001.
Figure 2.1
Ohio’s deviation from the trend raises a red flag. Only 15 states saw a decrease in their statewide median wage, and Ohio had the fourth largest decrease.[54] Another year of data will tell us if this is a blip or a larger concern.
Affordability: Even typical jobs no longer provide economic security
Even with a median-wage job, Ohio is unaffordable for families. The statewide median wage of $24.90 is a little under $52,000 a year. That may be enough to cover the basics for a single adult, whose statewide average cost of living is approximately $43,000 a year.[55] However, it’s not enough for even a small family to get by —especially when the wage loses purchasing power to inflation.
Take the fictional family, the Hills. The Hill Family consists of Mom, Dad, and soon-to-be Baby. Mom and Dad both work full-time year-round, with Mom paid the statewide median wage and Dad paid the minimum. At the end of 2024, Mom’s employer didn’t give the cost-of-living raise she hoped for, meaning the only increase in income Mom and Dad received was from Dad’s minimum wage inflation-adjustment of 25 cents an hour. They entered 2025 with a household income of $74,048.[56] Mom and Dad had wiggle room in their budget when it was just the two of them,[57] but now that Baby has arrived, their ability to save for the future has vanished. Increased food, healthcare, and housing costs paired with the new need for childcare puts the cost of living for the Hill Family at $85,945 — over $10,000 more than their annual income.[58]
Wages fell across the spectrum
The Hill Family shows us that, especially for the 50% of Ohioans making less than the median wage, affordability is a pervasive issue.[59] In 2025, wages were down across the wage spectrum,[60] meaning that wages did not rise enough between 2024 and 2025 to make up for increasing prices.
The average wage among the lowest-paid 20% of Ohio workers lost 1.5% of its value from 2024 to 2025, dropping to $15.07. The meager inflation-adjustment to the minimum wage was not enough to make up for the broad wage suppression experienced by the remainder of those Ohioans paid below $15.07 per hour.
At the low end of the wage scale, even a small loss of purchasing power can create big problems for the household budget. The same is not necessarily true for high-income households. The highest-paid 20% lost the greatest share (-4.2%) of purchasing power to inflation in 2024,[61] but because of decades of policy benefitting the wealthiest, their average wage is still more than three times that of the lowest-paid 20%, as shown in Table 2.1.
Table 2.1
This disparity in wages is a long-standing trend. Since 1979, Ohioans in the lowest 20% of wage earners saw an increase of only $3 in their hourly wage, when accounting for inflation. Over the same period, the highest-paid 20% experienced four timesthat growth, an increase of $12.57 per hour, more than any other income group.
With wages down across the board and the unemployment rate[62] increasing for the second year in a row, data is beginning to suggest an impending economic downturn. This decline in wages and economic turmoil has greater implications for the lowest-paid Ohioans, who spend more of their income on necessities than higher-paid Ohioans do.
Compared to 2024, the lowest-paid Ohioans are making nearly $500 less annually[63] adjusting for inflation. To the top 20%, $500 may not seem like much. But for a family with an income under $32,000 a year, $500 can make all the difference. The monthly cost of food for the Hill Family — for a nutritious, practical, cost-effective diet — is almost $700.[64]
The affordability crisis is as much about wages as it is prices. As determined by EPI,[65] the cost of living for one adult and one child is greater than the year-round wage for the vast majority of Ohioans. Only the top 20% can comfortably afford a single child, as shown in Figure 2.2.
Figure 2.2
No matter how hard one works, how many jobs they take on, how many lattes they skip, wages simply aren’t high enough. The affordability crisis is not a result of poor family financial planning — it is a product of wage suppression and public policy designed to serve the few instead of the many.
Unequal impacts: Wage inequities continue to hold back women and workers of color
Pay inequity is pervasive across demographic groups, not just socioeconomic status. The tight labor market resulting from the COVID-19 pandemic spurred wage growth for a majority of Ohioans, but that growth was not distributed evenly.
This section primarily analyzes rolling averages,
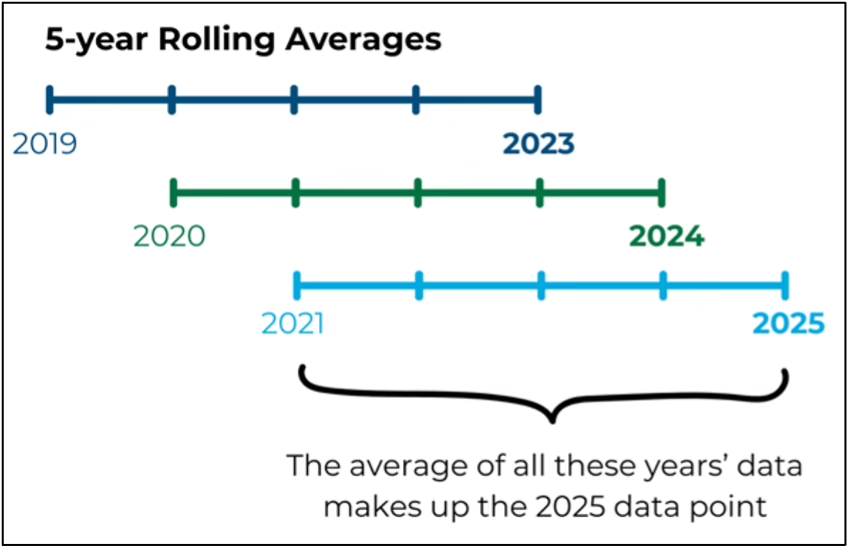 [66] which combine data from multiple years. For example, rolling averages for 2025 use 2025 data and the data from the four years prior.
Rolling averages ensure adequate sample size, which is sometimes necessary when looking at intersecting characteristics, like race and gender. They also help control data volatility to demonstrate longer-term trends more clearly. While annual data is critical for examining recent changes in the economy, rolling averages help distinguish between trends and blips. Comparing the two can also be revealing.
For example, rolling averages from the past five years show modest median wage growth for nearly all race/gender combinations[67] — see Figure 2.3. But using 2025 data alone, wages were down across the board. This disparity suggests the modest wage growth demonstrated in Figure 2.3 likely reflects gains made during the tight post-pandemic labor market, not in the past year.
Data limitations and rolling averages
In past years, data has been substantial enough to allow analysis for year-over-year intersectional demographic breakdowns — like looking at the changes in wages for Black women, instead of Black people or Women overall.
Over the years, the response rate to the Current Population Survey, the primary source of wage data in this report, has declined. March 2026 has the lowest response rate in the last 13 years at 63.9%. For comparison, the response rate in January 2013 was 90.3%. According to the Bureau of Labor Statistics, this is due to privacy concerns, difficulty contacting respondents, and respondents being unable to provide data when contact is made.*
Because of low response rates, data from a single year may not be statistically significant for some populations. To analyze intersectional wage trends, we use 5-year rolling averages. This method allows analysis over time with small sample sizes by averaging consecutive data points for a set time frame. For this reason, the trends illustrated from rolling averages may not align with the trends illustrated from time-series data, which is used when sample sizes are sufficient.
*See: CPS Response Rates. Bureau of Labor Statistics. Modified July 17, 2025.
The only exception to the 5-year rolling wage increases is Hispanic / Latina Ohioans: The two-year decline in their rolling averaged wage means that wage suppression has been bad enough to offset the wage gains in 2021 and 2022.
Figure 2.3
These data show a long-term and well-established trend of pay inequity impacting Ohio women and people of color especially. Systemic racism[68] and sexism[69] perpetuate these trends — a result of inaction from legislators to redress long-standing harmful policy. Ohio women and people of color are still facing pay inequity, with only white women coming within $5 of white men’s averaged hourly median wage. Societal biases embedded in our economic systems cause disproportionate representation of some demographic groups within an industry or occupation, like women and especially Black women in the childcare field.[70] Nationally, even when controlling for occupation, women, Black, and Hispanic/Latine workers are paid substantially less: the U.S. Department of Labor reported that in Service occupations, white women made $0.69 to the white, non-Hispanic man’s dollar, Black women $0.67, Asian women $0.66, and Hispanic women only $0.59.[71]
Union protections can serve as an equalizer.[72] When workers are able to organize and bargain without undue barriers, they can implement pay structures and policies in their collective bargaining agreements (CBAs) that greatly reduce and potentially eliminate wage gaps. In a CBA, workers can bargain for wage minimums, wage brackets for each position, salary transparency, and the process for distributing raises.

“Issues arise at all workplaces, and with the union we have a seat at the table and can address them collectively…Every worker deserves a union!”
Tim, Library worker, Worthington
Unions can also influence wages for nonunion workers too. When workers at unionized workplaces bargain for higher wages for their members, employers of nonunion workplaces must raise their wages to remain competitive in the hiring market. National data shows that unionization declined from 1979 to 2024, but where it declined less, median wages rose more.[73] In other words, states with more unionized workers have stronger wage growth.
Lessons from other states: Stronger unions help workers earn more
Having a union can make all the difference in wages and quality of work. States with “right-to-work” (RTW) laws — a misnomer prohibiting workplaces from requiring union membership or dues payment as a condition of employment — have lower median wages and union representation rates on average.[74]

“Higher wages mean not having to choose between healthcare and groceries … When you have enough money to provide for baseline necessities, you can start living life rather than merely surviving.”
Jade, Library worker, Worthington
For the 26 states with RTW laws, the average union representation is 6.9% and average median hourly wage is $24.04. For the 24 states and District of Columbia that do not have RTW laws, including Ohio, the average union representation is 14.8% and average median hourly wage is $27.98.
Illinois is one example of a non-RTW state that also has additional protections in place for workers. In 2022, Illinois voters passed the Worker’s Rights Amendment declaring “no law shall be passed that interferes with, negates, or diminishes the right of employees to organize and bargain collectively.”[75] Last year, Illinois legislators amended existing law to set a first contract timeline for newly formed unions,[76] an important piece of legislation closing a loophole for employers indefinitely pushing off bargaining.
Figure 2.4 illustrates union representation across the United States, with dark blue indicating greater union representation and light green indicating low union representation. States with diagonal shading have a lower statewide median wage than Ohio’s. Of the 25 states with a median wage higher than Ohio’s, 16 also have greater union representation.
Figure 2.4
It is generally the case that states with greater union density have greater median wages, as illustrated in Figure 2.4 above. For example, Illinois has a union representation of 14%, 1.2 percentage points more than Ohio’s 12.8% union representation.[77] Illinois’ lead over Ohio union representation is reflected in the difference in statewide median wage: Illinois’ 2025 median wage was $27.03, while Ohio’s was $24.90.[78]
By strengthening protections for unions and rejecting efforts to undermine collective bargaining, Ohio legislators could increase wages up and down the pay scale.
Federal landscape: Policies are weakening workers’ bargaining power
The tight labor market resulting from the COVID-19 pandemic gave low-paid workers leverage in the short term, but policy choices — especially at the federal level — gave that leverage back to employers. Poorly targeted tariffs[79] and the gutting of federal agencies[80] has injected uncertainty to business forecasting, causing hiring slowdowns and mass layoffs. When workers have to compete for jobs, rather than employers for workers, employers have the upper hand in wage setting.
Ohio workers are producing more wealth than ever, but it’s not showing up in their paychecks. Since 1979, productivity[81] in Ohio increased 84% while median compensation increased only 22%, as shown in Figure 2.5.[82]
Driven by the median wage’s loss in value, Ohio’s median compensation (which includes wages and benefits) also lostvalue over the last year, dropping 2 percentage points since 2024.
While some of the change in productivity is due to technological innovation, decades of policy transferring wealth from the middle class to the top 1% through excessive tax cuts, offshoring union jobs,[83] and unrestricted corporate power has allowed employers to undercut workers. The staggering difference in growth between productivity and compensation is evidence that hard work does not necessarily mean greater economic prosperity — especially when policy is rigged against the typical American worker.
Figure 2.5
Unprecedented federal attacks on unions have also helped hold down wages.[84] In 2025, the Trump administration put collective bargaining rights at risk for more than one million federal workers,[85] 81,074 of them in Ohio.[86] The administration has also gutted the offerings of the Federal Mediation and Conciliation Service, preventing unions from accessing free mediation services to resolve labor disputes.
In short, pay is a policy choice. Anti-worker policies at the federal level make it even more crucial for Ohio legislators to step up for the people they represent.
The cost of inaction: Declining union power costs Ohio workers billions
Ohio had peak union representation in 1979, with 35.5% of the workforce (1.57 million) represented by a union.[87] Through decades of offshoring traditionally union work, union-busting, and collective bargaining attacks, Ohio’s union representation is now 12.8% as of 2025, or less than 666,000 workers.[88]
In 2025, the union wage premium — how much more a union worker makes than a non-union worker — was 14.2%.[89] If a non-union worker was paid the Ohio median wage of $24.90, a 14.2% wage premium would equate to $28.44 per hour for union-represented workers. Over the course of a year, that’s upwards of $7,000 more in the pockets of union-represented workers.[90]
If in 2025 Ohio had the same share of union representation that it did in 1979, nearly 1.2 million more Ohio workers would be represented by a union, and that 14.2% union premium would mean an additional $8.67 billion a year for working Ohioans.
Policy recommendations
The Ohio median wage is just enough to cover the basics for a single adult in most counties. That means half of working Ohioans are paid too little to get by, even without any children. Add a child to the mix and the state median wage is simply inadequate. Ohio legislators have a variety of policy solutions to choose from, any of which would improve Ohioans’ bottom line:
- Prevent the passage of Ohio House Bills 510, 512, 513, and 965, all of which weaken union and worker protections.
- Require first contracts to be bargained within a certain timeframe after union recognition, like Illinois did.
- Address worker misclassification. Too often, workers are misclassified as independent contractors or salaried employees, allowing unscrupulous employers to skirt labor law.[91]
- Require development projects receiving subsidies and tax incentives to pay all workers involved in the construction and operation of the development a livable wage.[92]
- At the federal level, Congress should pass the Protecting America’s Workforce Act. This piece of legislation would reinstate collective bargaining rights for federal workers. It has passed the U.S. House of Representatives and is with the Senate now.
<Read Part 1: Minimum Wage || Read Part 3: Unemployment Compensation>
[53] EPI, State of Working America Data Library, “Hourly wage, median – Median real hourly wage (2025$),” 2026.
[54] In order of median wage decrease: Nevada, Utah, Colorado, Ohio, Arizona, New Jersey, Oklahoma, Kentucky, Rhode Island, Iowa, Massachusetts, Tennessee, Washington, North Dakota, and Virginia. EPI, State of Working America Data Library, “Hourly wage, median – Median real hourly wage (2025$),” 2026.
[55] Using a weighted average of all Ohio counties as a share of state population, based on Family Budget Calculator data and American Community Survey 5-year estimates 2019-2024.
[56] The 2025 median wage, $24.90, annualized is $51,792 and the 2025 minimum wage, $10.70, annualized is $22,256. The 2024 minimum wage was $10.45 per hour. Economic Policy Institute, State of Working America Data Library, “Hourly wage, median – Median real hourly wage (2025$),” 2026.
[57] Using a weighted average of all Ohio counties. The cost of living for two adults is $59,002.
[58] Using a weighted average of all Ohio counties. See: Ohio median wages fall short, Heather Smith. Policy Matters Ohio. June 29, 2026.
[59] “Low-wage workers faced worsening affordability in 2025 as wage growth stalled,” Elise Gould and Joe Fast. Economic Policy Institute. February 5, 2026.
[60] Each decile of wage earners saw an average decline in their wages; however, this could still include wage increases for some individuals. Source: EPI, State of Working America Data Library, “Hourly wage percentiles – Real hourly wage (2025$),” 2026. Unless otherwise noted, the remainder of the data for this section is from this source.
[61] Data did not indicate any changes in industry composition and demographics that could explain the greater wage decreases experienced by higher-wage individuals. More likely the case is that the data are simply “noisy” – that high-wage data varies more due to higher-wage individuals having greater trade-offs in compensation (like benefits, work-from-home flexibility, stock incentives, etc.) that makes it hard to pin down hourly wage changes.
[62] See this report’s section “Unemployment Compensation.”
[63] If working full-time, year-round. In 2024, the lowest 20% of workers received an annualized $31,833. In 2025, they received $31,354.
[64] Using the U.S. Department of Agriculture’s Thrifty Food Plan for one female 20-50 years old, one male 20-50 years old, and one child 1 year old. Total is $683.20 for May 2026. See: USDA Food Plans: Monthly Cost of Food Reports .
[65] “Family Budget Calculator.” Economic Policy Institute. Accessed March 4, 2026.
[66] Source: EPI analysis of CPS ORG data.
[67] Not including AAPI Ohioans, whose sample sizes were too inconsistent to determine wage changes reliably.
[68] “Minimum Wages and Racial Inequality,” Ellora Derenoncourt and Claire Montialoux. The Quarterly Journal of Economics. Vol. 136, Issue 1. February 2021.
[69] Equal Pay Act of 1963. U.S. Equal Employment Opportunity Commission.
[70] Ohio’s childcare crisis, 2025. Kathryn Poe, Ali Smith, and Heather Smith. Policy Matters Ohio. April 15, 2025.
[71] Earnings and earnings ratios by sex, race, and occupation group. U.S. Department of Labor Women’s Bureau. Updated April 2026.
[72] Workers’ resolve drives increase in unionization in 2025. Celine McNicholas, Margaret Poydock, and Heidi Shierholz. Economic Policy Institute. February 19, 2026.
[73] Unions aren’t just good for workers—they also benefit communities and democracy. Celine McNicholas, Margaret Poydock, Heidi Shierholz, and Hilary Wething. Economic Policy Institute. August 20, 2025.
[74] Author’s calculations using data from EPI’s State of Working America Data Library: “Hourly wage, median – Median real hourly wage (2025$),” 2026; Union membership – Share represented by a union,” 2026. See also Data show anti-union ‘right-to-work’ laws damage state economies. Jennifer Sherer and Elise Gould. Economic Policy Institute. February 13, 2024.
[75] Illinois Workers’ Rights Amendment sets new bar for state worker power policy. Jennifer Sherer. Economic Policy Institute. December 7, 2022.
[76] Senate Bill 453. Illinois 104th General Assembly. Effective August 15, 2025.
[77] EPI, State of Working America Data Library, “Union membership – Share represented by a union,” 2026.
[78] EPI, State of Working America Data Library, “Hourly wage, median – Median real hourly wage (2025$),” 2026.
[79] “Uncertainty over (Trade) Policy Will Cut Hiring and Investment, Say Business Execs,” J. Maria Barrero, N. Boom., S. Davis, K. Foster, A. Jalca, B. Meyer. Federal Reserve Bank of Atlanta. May 15, 2025.
[80] “Trump administration says about 4,200 federal employees face layoffs,” S. Fowler, A. Hsu, S. Simmons-Duffin, S. Gringlas, D. Shivaram. NPR. October 10, 2025.
[81] In previous years, Policy Matters has measured change in productivity using the gross state product divided by the number of workers in the state. Going forward, we will align with the Economic Policy Institute’s methodology, which divides the gross state product by the state’s share of hours worked. In addition to better capturing the impact of part- and full-time workers on the state’s productivity, the new methodology also incorporates capital depreciation, ensuring the change in productivity is not overstated. Additionally, we now include the change in median compensation, not just change in median wage, to illustrate the impact of employment benefits like health care. See EPI analysis of total economy data from Bureau of Labor Statistics, Labor Productivity and costs program; employment data from Bureau of Labor Statistics, Current Employment Statistics survey; wage data from the Current Population Survey and compensation data from the Bureau of Economic Analysis, State/National Income and Product Accounts public data series.
[82] Source: EPI analysis of total economy data from Bureau of Labor Statistics, Labor Productivity and costs program; employment data from Bureau of Labor Statistics, Current Employment Statistics survey; wage data from the Current Population Survey and compensation data from the Bureau of Economic Analysis, State/National Income and Product Accounts public data series.
[83] A quarter century of working in Ohio. Heather Smith, Hannah Halbert, and Ali Smith. Policy Matters Ohio. September 11, 2025.
[84] Ohio falls behind on union representation. Heather Smith. Policy Matters Ohio. April 29, 2026.
[85] Trump is the biggest union-buster in U.S. history. Patrick Oakford and Margaret Poydock. Economic Policy Institute. September 2, 2025.
[86] Analysis of 2023 American Community Survey and 2025 Current Employment Statistics data. Ben Zipperer. Economic Policy Institute. March 5, 2025.
[87] Applying Ohio’s peak union density (35.5%) to the 2025 Ohio workforce of 5,196,000, we estimate 1,844,580 Ohioans would be represented by a union. Subtracting the current number of union-represented workers of 665,818, an additional 1,178,762 Ohio workers would be represented by a union. The median wage is a representation of the typical worker – half of workers make more and half make less. Using this wage as a comparison point cannot fully capture the impact of the union wage premium across industries, occupations, and demographic differences. However, due to data availability, using the state median wage produces the best estimate. If a worker was working full-time, year-round, the state median wage equates to $51,792 annually. Applying a 14.2% union wage premium to that wage, gives an estimated additional $7,354.46 to union-represented workers for an annualized wage of $59,146.46. We then multiplied the annualized union wage premium of $7,354.46 by the additional number of union-represented workers, were Ohio at peak union density, and calculated an estimated annual wage bill increase of $8,669,161,562.71. See: Economic Policy Institute, State of Working America Data Library, “Union membership – Share represented by a union,” 2026. “Union Members in Ohio — 2025.” Bureau of Labor Statistics. March 6, 2026.
[88] EPI, State of Working America Data Library, “Union membership – Share represented by a union,” 2026.
[89] EPI, State of Working America Data Library, “Union wage premium – Union wage premium, average (regression-based),” 2026.
[90] A recent report from EPI supports this finding at the national level: If the U.S. had 30% union density (as opposed to the current 10% national union density), a full-time, year-round worker paid the median wage would see an annual raise by more than $7,700.
[91] Honest Day’s Pay. Michael Shields. Policy Matters Ohio. May 18, 2022.
[92] Data Centers Policy Platform. Molly Bryden. Policy Matters Ohio. February 24, 2026.